
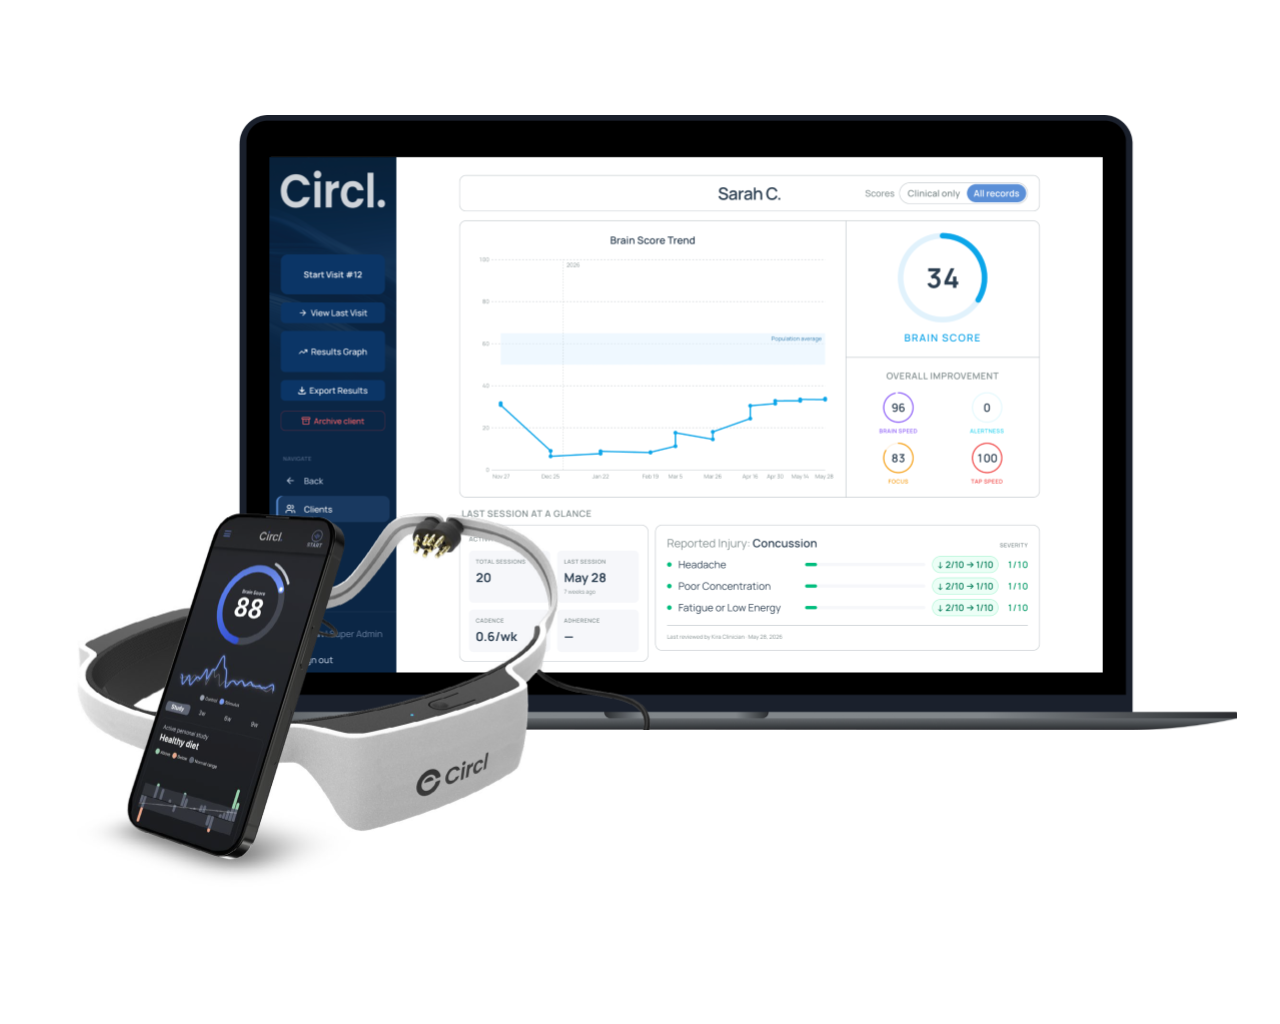
How it works
A 10-minute EEG assessment and a clinician dashboard that turn each visit into objective data on how your patient's brain is healing.

Research-grade EEG, without the lab
Accurate brain measurement has meant six-figure EEG systems, a trained technician, and up to two hours per test — confined to university labs.
Circl delivers the same validated signal in a 10-minute test any trained staff member can run inside a normal appointment — no technician, no gel cap.

STEP ONE
Take the test. Establish a baseline.
Your patient completes a 10-minute visual assessment in the Circl app. Setup takes 30 seconds — the two-sensor headset goes on like a hat.
You get an instant Brain Score — the patient's baseline — before they leave the room.
STEP TWO
Track changes over time
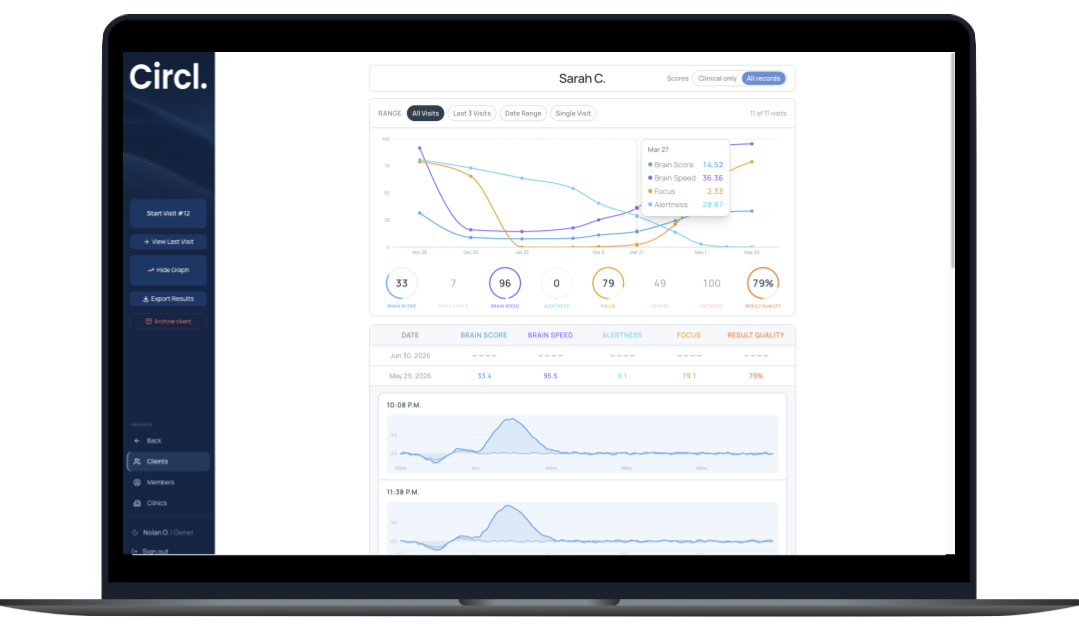
Test at every visit, and the clinician dashboard charts each patient's recovery trajectory against their own baseline.
See change-from-baseline on every metric, session over session — the trend a symptom checklist can't show.
Every reading is time-stamped documentation you can export for charts, payers, and referral letters.
STEP THREE
Understand what’s changing
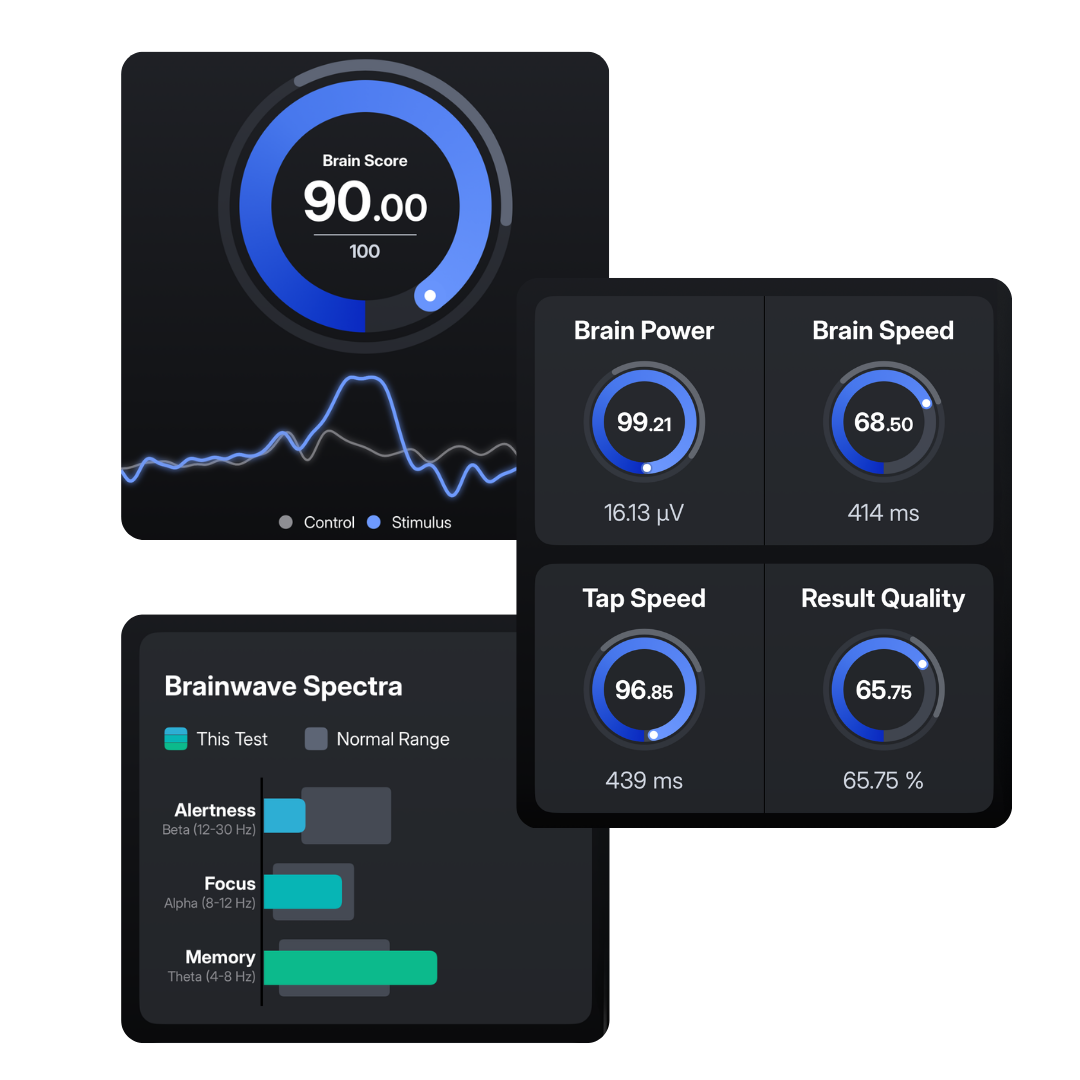
Every session returns a Brain Score plus five metrics — brain power, brain speed, alertness, focus, and memory.
Log your patient's symptoms and the treatment you delivered against each reading, right in the dashboard.
So you see not just that a patient is improving, but which of your interventions moved the needle.

Fast enough to run every visit — and it pays for itself
A flat monthly subscription, no per-test fee. Clinics bill CPT 96132, and the busiest cover the subscription in about three days of testing. Test more, at no added cost.
Inside the clinician dashboard
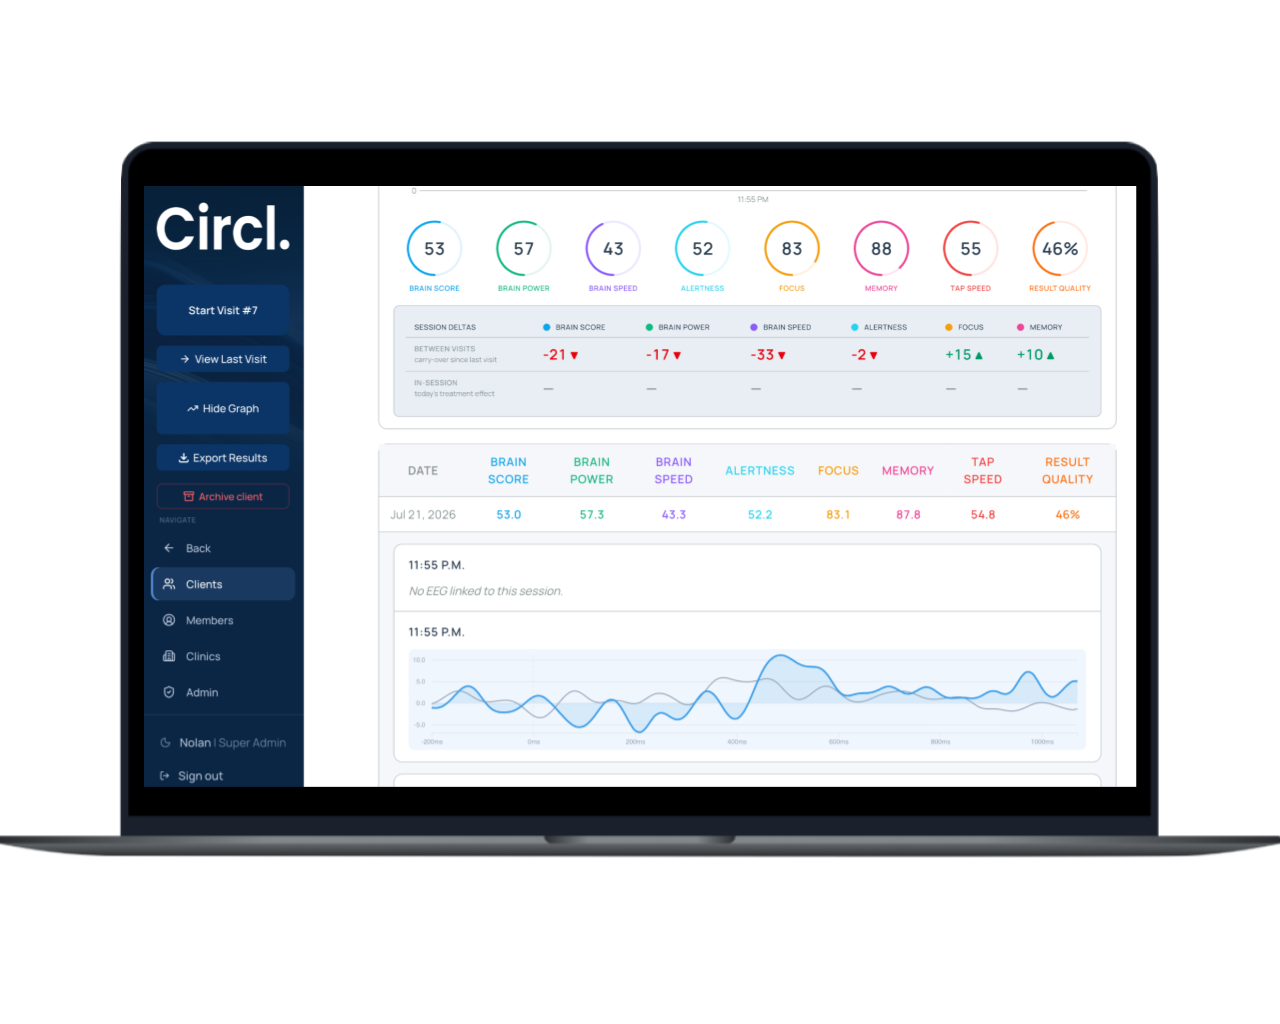
The dashboard is where the clinical decision happens. The headset collects; this is what you actually use.
For each patient it plots the Brain Score and all five metrics across every session, with change-from-baseline called out on each visit.
Underneath every reading is the P300 — a time-locked brainwave response the brain produces during the in-app task, and one of the most validated markers in neuroscience. Because it's time-locked, it preserves the temporal detail that tracks healing.
Symptoms and treatments logged alongside each reading turn the dashboard into a record of what's working, patient by patient.

What each metric means
Circl records brainwave activity at the scalp during the 10-minute task and returns standardized, comparable metrics the moment the session ends:
Brain Score
A composite measure of overall cognitive function.
Brain Power
Reflects the brain’s capacity to process information and sustain cognitive effort.
Brain Speed
Measures how quickly and accurately the brain responds to new information.
Alertness
Indicates responsiveness to changes in the environment.
Focus
Assesses the ability to concentrate and filter distractions.
Memory
Evaluates information retention and recall over time.
The Circl Advantage

See what symptoms hide
Detects healing changes that functional assessments and symptom checklists miss.

Fits the visit you have
30-second setup, 10-minute test — inside a normal appointment, run by any trained staff member.
Results in the room
A Brain Score and five metrics appear immediately to inform optimal treatment decisions.

Built for a clinic
Multiple clinicians, many patients, one dashboard — with secure, individual patient records.

Baseline to trajectory
Each patient is measured against their own baseline and population norms, visit over visit.

The data compounds
Every-visit testing builds healing trend signals per injury — so the dashboard reads trends, not isolated numbers, to optimize your treatments for each brain healing stage.

Give your clinic something few others can offer
Show patients and referrers a measured recovery curve, document progress objectively for payers, and differentiate your clinic in concussion and mTBI care.
Our commitment to you.
How your patients' data is protected
Clinics trust Circl with sensitive patient data, and we treat it that way. Brainwave data is collected solely to produce the objective measurements you use with your patients — never sold, never shared.
Trustworthy protections*
Brainwave data is encrypted in transit and at rest, with security as the foundation of every Circl policy.
The only identifier in our system is a randomly generated code that links test data to a patient account. Circl never sees who your patients are — you manage that link in your clinic.
Importantly, our secure analytics engine is required to make raw test data readable. Without processing data through our analytics engine, test results are unintelligible.
*Encryption methods include Transport Layer Security (TLS) for data in transit and 256-bit AES security for data at rest (stored on servers). We periodically update our security practices to conform with Microsoft recommendations.
FAQs
-
No. Circl was designed for occupational, physical, and athletic therapists. Any trained clinic staff member can place the headset and run a session — no neurodiagnostic credential required.
-
No. Circl is not a diagnostic device. It measures change in cognitive processing over time to support your clinical decisions. Diagnosis remains yours, and Circl doesn't replace imaging when a CT or MRI is warranted.
-
Every visit. The subscription is flat specifically so that frequency costs nothing extra, and the recovery trajectory — not any single reading — is where the clinical value is.
A persistent negative trend is a concern and indicates a potential risk of a significant brain health issue.
-
Clinics typically bill CPT 96132 and legal firms. Reimbursement depends on your payers, jurisdiction, and credentials — we'll walk through your specific situation on a demo.
-
Circl is built on mobile EEG signal processing that resolves brainwave activity to millionths of a volt with millisecond timing. The underlying P300 signal has 60+ years of peer-reviewed research behind it, and Circl's own validation study covers 285 participants across 751 sessions.
-
Only the patient's clinic and anyone they explicitly authorize. Brainwave data is encrypted and de-identified, and Circl complies with applicable privacy laws in the markets it operates in.
-
The headset is a passive recorder of the brain's electrical activity — the same technology used in neuroscience labs for decades — and emits no energy. Circl is currently supplied as a research device; we are pursuing FDA 510(k) Class II clearance, with Health Canada licensing in parallel.